Using console.log to debug frontend is easy but absolutely not effective. As Next.js@9~ was born, debug Next.js + Typescript became possible. But unfortuately, there’s only server side debug manual in Vercel’s official site documentation. Let’s dig a little more deeper to find out how to debug Next.js + Typescript in both server and client side.
Who is concerned about official documentation, please see here
Common Settings
No matter debug in server side or client side, we should first start a Next.js project first by npm run dev.
Debug server side
As written in official site, we have to add NODE_OPTIONS='--inspect' to dev script in package.json like this:
{
  "scripts": {
    "dev": "NODE_OPTIONS='--inspect' next dev ./src"
  }
}
And then, add following json to .vscode/launch.json:
{
  "type": "node",
  "request": "attach",
  "name": "Next: Node",
  "skipFiles": ["<node_internals>/**"],
  "cwd": "${workspaceFolder}/src",
  "port": 9229
}
After running npm run dev, we could start our debug life by selecting Next: Node config in debug tab. And from now on, we’re able to add breakpoints to out project. VSCode will catch the point when we load the pages by server side rendering. (F5 to refresh or access the page by urls directly)
Debug client side
Of course there’re only few links in official documentation and we could only find a very little information from Google as well. But any way, I tried the following settings at first time. (in .vscode/launch.json)
{
  "type": "chrome",
  "request": "launch",
  "name": "Next: Chrome",
  "url": "http://localhost:3000",
  "webRoot": "${workspaceFolder}/src",
  "sourceMaps": true
}
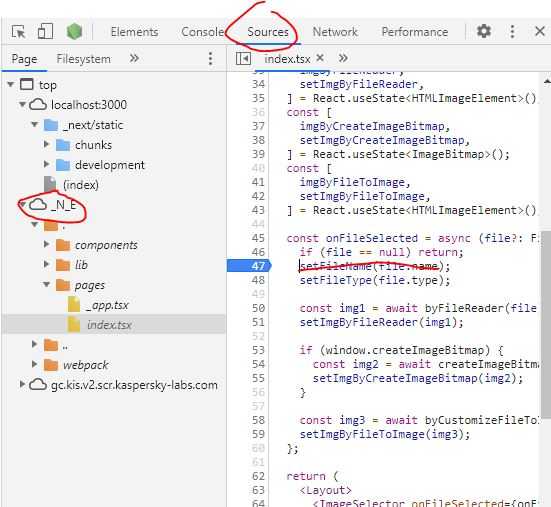
After startup this debug, VSCode will not stop at out breakpoints. But good news is that, open Chrome’s devtool by F12, we will notice there’s a strange folder called _N_E in devtool’s source tab. And these source code are not transpiled so we’re able to add breakpoints here and enjoy out debug life! ☕️

But WTF is _N_E!?? After checking Next.js source code, we can understand it’s a webpack5’s option to alias the library name. Perhaps _N_E refers to NExt.js??

So comes the following idea, we could override the sourmap path to enable debuggin in VSCode instead of in Chrome’s devtool. In .vscode/launch.json Next: Chrome part:
"sourceMapPathOverrides": {
  "webpack://_N_E/*": "${webRoot}/*"
}
Grab all(.vscode/launch.json)
{
  "version": "0.2.0",
  "configurations": [
    {
      "type": "node",
      "request": "attach",
      "name": "Next: Node",
      "skipFiles": ["<node_internals>/**"],
      "cwd": "${workspaceFolder}/src",
      "port": 9229
    },
    {
      "type": "chrome",
      "request": "launch",
      "name": "Next: Chrome",
      "url": "http://localhost:3000",
      "webRoot": "${workspaceFolder}/src",
      "sourceMaps": true,
      "sourceMapPathOverrides": {
        "webpack://_N_E/*": "${webRoot}/*"
      }
    }
  ]
}
Finish
Have fun with your new debug life!

